One area where many professional advisors disagree with academics is whether stock investments tend to become less risky as you go out in time. Advisors say that the longer you hold stocks, the more the ups and downs tend to cancel each other out, so you end up with a smaller band of outcomes than you get in any one, two or five year period. Academics beg to disagree. They have used complex mathematics to form the basis of their argument that, just as it is possible to flip a coin and get 20 consecutive “heads” or “tails,” so too can an unlucky investor get a 20-year sequence of returns that crams together a series of difficult years into one unending parade of losses.
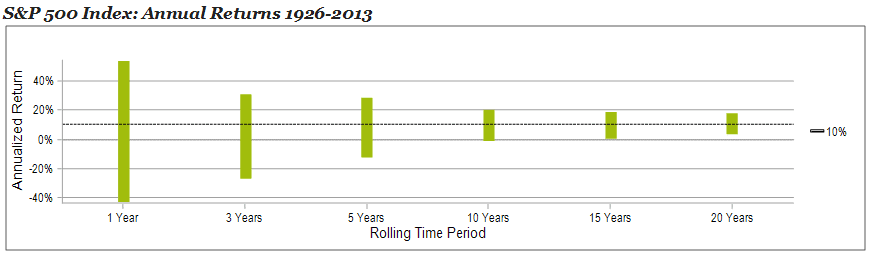
Based purely on U.S. data, the professional advisors seem to be getting the better of the debate. As you can see in the accompanying chart, which shows rolling S&P 500 returns from 1926 through 2013, the range of returns narrows over time and comes closer to the average of 10%. The outcomes in any one year have a wide range of returns with a low of -43% starting in 1932 followed by the highest of 54% in 1934. But if you hold that stock portfolio for ten years, the best and worst returns narrow -1% starting in 2000 and 20% in 1950. No 15-year time period has had a negative annual rate of return.
It is important for retirees to remember this, since they should generally hold stocks as part of their diversified portfolio. The bond portion may cover expenses needed from the portfolio for 5 to 20 years, depending on how well the retirement plan is funded. Moreover, this allows stocks to provide inflation protection via time diversification even for a retiree.
However, the U.S is a limited data set. What happens if you look at other countries and extend this research over longer periods? This is exactly what David Blanchett at Morningstar, Michael Finke at Texas Tech University and Wade Pfau at the American College did in a new research paper. The authors examined real (inflation-adjusted) historical return patterns for stocks, bonds and cash in 20 industrialized countries, each over a 113-year time period.
What did they find? They found that in general, people experienced less risk holding more stocks over longer time periods. The only exceptions were short periods for investors in Italy and Australia. Overall, the authors found that investors should generally increase their stock allocations and that increase should be greater the longer the time horizon they have.
Does that mean that returns in the future are guaranteed to follow this pattern? Of course not. But there seems to be some mechanism that brings security prices back to some kind of “normal” long-term return. It could be explained by the fact that investors tend to be more risk-averse when valuations are most attractive–think 2009 when stocks are on sale but investors are smarting from recent market losses. The converse is that investors are most tolerant of risk during the later stages of bull markets. In other words, market sentiment seems to view the future opportunity backwards.
Is it possible that stocks are not really fairly priced at all times, but instead are constantly fluctuating above and below some hard-to-discern “true” or “intrinsic” value, which is rising far more steadily below the waves? That underlying growth would represent the long-term investment return, and this certainly seems to be the case. This is one case where practical, real-world observations seem to win out over complex theoretical models of some academics.
Kevin Kroskey, CFP®, MBA is President of True Wealth Design, an independent investment advisory and financial planning firm that assists individuals and businesses with their overall wealth management, including retirement planning, tax planning and investment management needs.