

Deceptive Advisor Marketing: Manipulated Investment Performance
Investment advisors have pioneered clever ways to make themselves look far better than they actually are. Some of these practices were recently exposed in “Debunking Deceptive Sales Pitches” published the Journal of Financial Planning. To the untrained eye these practices can make an ordinary investment company or advice-giver look like a genius.
The Stupendous Selector
Suppose an advisor says that he has the ability to hand-select terrific investment opportunities for his customers. To prove it, he shares with you the names of the individual stocks, mutual funds, or separate account managers that he has in client portfolios. He shows you their track records, and indeed their long-term returns are impressively above average. Where do you sign?
The problem is that you have no way of knowing when he selected these investments or if they comprise all of the investments he has selected. He may have chosen them last week or last month, cherry-picking the best long-term track records he could find. Showing you what he’s invested in today doesn’t tell you what funds he was recommending last year or over the last ten years nor the actual total returns clients have received over time. There is a survivorship bias to the reported results as subpar investments the advisor has selected in the past have been retroactively and conveniently weeded out of the portfolio.
This pitch should tell you to run for the hills. Picking hot investments often leads to disappointment. They have a tendency to cool off, regressing back to the mean, delivering returns as low as the previous returns were high, and reducing your wealth.
The Modeled Maverick
This sleight of hand is very prevalent today as many mine through market data to come up with a winning recipe. You will commonly see investment advisors reporting returns over past time periods that are purely hypothetical and footnoted as such in very small print. These advisors have created some rules-based model and have applied the model over time to generate back-tested returns. Commonly, 2008 with a -37% return on the S&P 500 is shown as being muted or side-stepped, implying if not being explicitly stating, “This is what you could have gotten.” Who wouldn’t want that?
While this may look great on a back-tested basis, the model is purely hypothetical and often has little to no basis in expecting future returns to be so astounding. Rather, one can make a strong case that if the model worked so well in the past this is the exact same reason it is unlikely to work so well going forward.
The Misaligned Mountain
Another you’ve probably seen over and over again is the classic “mountain chart” graph, which shows the total dollar value of $1 invested in an index (often the S&P 500) slinking along the bottom of the page, while the total cumulative value of a dollar invested in the fund, graphed year by year, forms impressive mountains in the sky near the top of the graph.
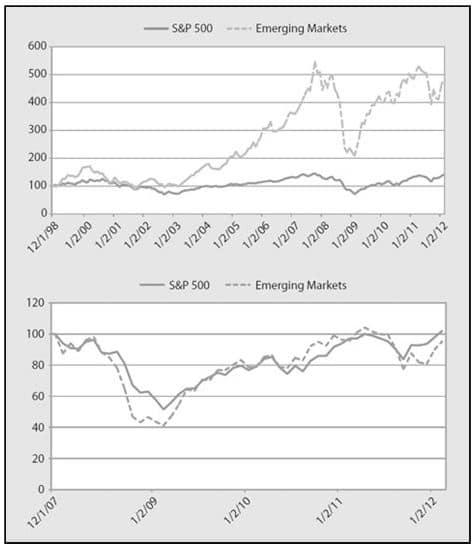
What can possibly be wrong with that? Every mountain chart shows comparative performance over a carefully-selected time period. If a fund had one really good year, chances are that’s what its marketing department will pick as the starting point. Every year thereafter, the portfolio will have more money invested than the benchmark index, so even if it runs about even with the index from there on or even loses ground, every return it does bring in boosts the total dollar value that much more. Many mountains are made out of one-year molehills.
You can see this demonstrated by graphing the S&P 500 index against emerging market stocks over two time periods. The chart at the top shows clearly that emerging markets are the true path to wealth—over a carefully-selected time period starting at the end of 1998. The chart at the bottom looks at more recent data, from the start of 2008 to the end of last year. Same two indices as the top chart, but emerging markets don’t look nearly as impressive in the lower graph.
There’s a point to this exercise. Whenever somebody implies that he has absolutely crushed the index competition—that he has, in other words, consistently beaten the markets by a considerable margin—you can be pretty sure you’re being deceived. Be very skeptical of anything that looks like an extraordinary track record.
Your advisor should be educating not exaggerating. Your advisor should be helping you set reasonable expectations that will allow you to remain disciplined throughout the investing process rather than setting you up for disappointment.
Kevin Kroskey, CFP®, MBA is President of True Wealth Design, an independent investment advisory and financial planning firm that assists individuals and businesses with their overall wealth management, including retirement planning, tax planning and investment management needs.


