

As I write this article in mid December, the S&P 500 is wrapping up an incredibly fruitful 2013. The market index has now been up five years in a row and ten out of the last eleven years, granted with a severe decline experienced in 2008. While investors can enjoy the recent run, we should also be asking questions about return expectations going forward.
Return Building Blocks
Returns for both bonds and equities can be decomposed into various components that contribute to the total return of each asset class. Recall the total return is income return plus or minus price return.
For bonds, these estimates prove to be relatively straight forward. The current yield for a ten-year note is 2.8%. If you bought this bond and held to maturity, you would receive a 2.8% return. Most investors tend to use a bond mutual fund and slight differences in returns will likely be experienced between bond funds and individual bonds. They may also purchase corporate or municipal bonds, which tend to have an increased yield relative to US Treasuries. Yet the current yield proves to be a sufficiently accurate estimate for future bond returns. Let’s assume 3% over the next ten years.
Equity returns are much more difficult to project. Equity returns can be decomposed into four key components shown in the table. Inflation expectations are based on the difference between the ten-year note and the ten-year treasury inflation protected note. The dividend yield is the income return from equities. It is also easily determined and can be seen as being considerably lower today compared to history. Of important note is that the standard deviation or variability in these components is relatively small compared to other constituent components.
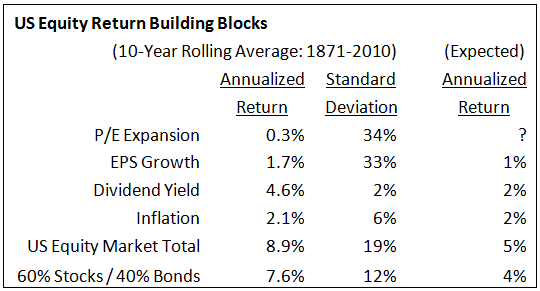 These other, more volatile components include changes in the price investors pay for equities, represented as Price to Earnings (PE) Expansion and Earnings Per Share (EPS) Growth. In total, earnings from companies can be thought of as being roughly equivalent to GDP. GDP growth has a long-term trend in the U.S. at 3%. However, EPS is on a per-share basis, and new share issuances of new and existing publicly-traded companies dilute GDP. 50%-60% of GDP is realized as EPS Growth. In the recent past EPS Growth has been quite robust with profit margins being at all-time highs. However, the historical record shows EPS Growth is not only volatile but also cyclical and tends to mean revert.
Considering these three variables, expected returns for the US Equity market are 5%. For a 60% stock and 40% bond investor, this equates to just 4%.
The Valuation Question
The final equity building block – PE Expansion – is also the most volatile. The recent 12-month PE is 19.6 and the historical average is 15.5. Robert Shiller, Economics Professor at Yale University and 2013 Nobel Laureate, made famous the Shiller PE, which averaged ten years of earnings to smooth out peaks, valleys, and accounting irregularities. Currently, the Shiller PE is 25.1 and the historical average 16.5. Either of these metrics shows the U.S. market to be over-valued.
While the price variable in PE is easily observed the earnings variable is somewhat controversial. The controversy comes into play when deciding whether to use one year, ten year, or some other time period for earnings. To complicate matters even more, others argue PE ratios are justifiably higher in times of low inflation, as we are currently in, or that the earnings methodology has materially changed and make the historical record not as useful.
Looking back on the historical record from 1926-2012, whenever the Shiller PE has been 25.1 or more, the next ten years have not been kind to investors. Ten-year returns averaged just 0.5% with a low of -4.4% and a high of 8.3% after-inflation. Even if one disagrees with the Shiller methodology, by most metrics the market is expensive.
What Should Investors Do?
First don’t panic and be rational. Shiller himself coined the now famous term “Irrational Exuberance” describing the technology bubble. However, he did so in 1996 and the market continued strongly upward until 2000. The Shiller PE is not a market-timing mechanism but a key variable to consider when shaping expectations and an asset allocation. It is important to realize that if PE ratios do revert back to their long-term averages, this implies that returns may be substantially more dismal than the table shows or even negative.
Most importantly update your financial planning and consider when you need the money. Bonds are not that attractive but do allow for certainty in meeting your lifestyle needs. Diversification into international equities also looks more appealing as most countries offer significantly higher dividend yields and much lower PE valuations compared to the US.
Kevin Kroskey, CFP®, MBA is President of True Wealth Design, an independent investment advisory and financial planning firm that assists individuals and businesses with their overall wealth management, including retirement planning, tax planning and investment management needs.


